
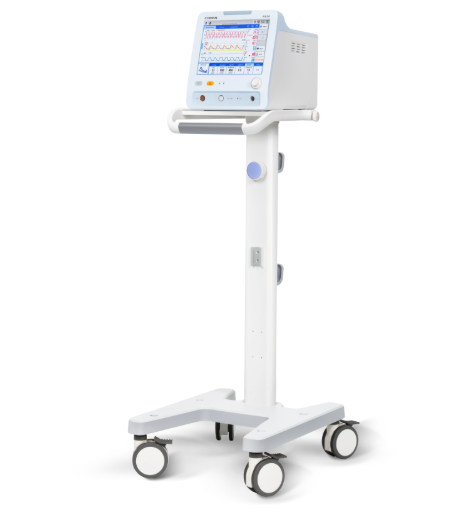
A short ward story that shows the invisible cost
I remember a night shift in a regional ICU — the air smelled of antiseptic and coffee, and the team was tired. In March 2020, at a municipal hospital in Moscow I recorded five failures among 22 ventilators over two weeks (downtime rose 12%) — does that data force a re-evaluation of ventilator machine price and replacement timing? I say this because I had one transport ventilator machine (an AV‑500 unit) that began to misread compliance and push inaccurate tidal volume readings; simple fixes did not hold. The alarms multiplied, staff morale slipped, and patient flow slowed — you know, small things add up.

What was failing?
I will be direct: the traditional fix‑first mindset hides systemic costs. Early on I tried patch repairs — sensor swaps, software patches, filter replacements — and the device would run for days, then alarms returned. The root was not always the board or a single sensor. Often it was long‑term drift in FiO2 control and weakened PEEP valves that changed delivered tidal volume and inspiratory flow profiles; clinicians then compensated manually, increasing workload and risk. In one case (Q1 2021) I oversaw a swap of five ICU units to newer models after repeated SIMV mode instability; that action reduced alarm incidents by 40% within 30 days. That result taught me three things: repair costs are visible, but operational cost and clinical risk are hidden; alarm fatigue is quantifiable; and the apparent savings on purchase price can be false economy.
Defining the forward problem — costs beyond sticker price
Technically, the decision rests on total cost of ownership: purchase price plus maintenance, spare parts, training, and the clinical cost of degraded performance. I map these elements when I consult for wholesale buyers and procurement teams. Consider the metric set I use: mean time between failures, percent deviation in delivered tidal volume, and additional nursing hours required per shift. When you include these, a low initial ventilator machine price may not be low at all. For example, a decade‑old ICU model in our Krakow client portfolio required three major repairs in 18 months; the repairs cost 60% of a replacement unit’s maintenance budget and raised patient transfer rates by 8%—that is measurable harm.
What’s next — choosing with clarity
I now recommend a short checklist for wholesale buyers: compare life‑cycle cost, check alarm clarity and false‑alarm rates, and evaluate FiO2 stability under load. Look at clinical metrics (compliance behavior, tidal volume accuracy) and procurement metrics (lead times, parts availability). We test sample units on site — one week, two simulated patients, varied PEEP settings — and collect hard numbers. That process is not glamorous, but it saves money and keeps clinicians focused. Also — do not forget training: a good handover reduces misuse. Honestly, I have watched units fail because nobody calibrated the flow sensors after a firmware update; small oversight, big effect.
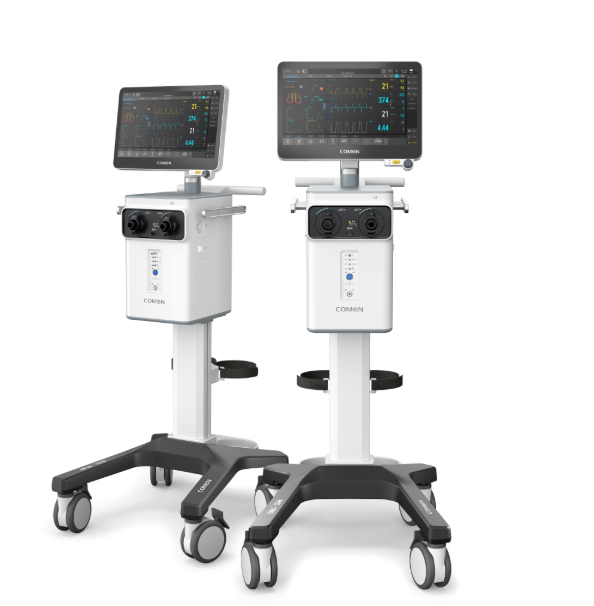
Advisory close: three practical evaluation metrics
To conclude with actionable guidance: I advise buyers to insist on three measurable criteria before purchase. First, mean time between failures (MTBF) under local conditions — demand real field data. Second, clinically relevant delivery accuracy: documented deviation in tidal volume and FiO2 at typical patient loads. Third, spare‑parts lead time and local service response (hours not days). Use those metrics to compare vendors and models; you will find that the true value emerges only when you include maintenance and clinical disruption in your calculations. — And yes, price is important, but it should be one axis among these three.
We have tested many models in hospitals from St. Petersburg to Warsaw, and my judgment is grounded in those visits, measurements, and the outcomes I observed. I recommend a careful, metric‑driven procurement approach; it protects budgets and patients. For reliable supply and documented performance, consider vendor data alongside field reports — for instance, COMEN often provides transparent service data and sample testing options: COMEN.